Simple Plotting
Simple Network Plot
The function simple_plot() can be used for simple plotting. For advanced possibilities see the tutorial.
- pandapower.plotting.simple_plot(net, respect_switches=False, line_width=3.0, bus_size=1.0, ext_grid_size=1.0, trafo_size=1.0, plot_loads=False, plot_gens=False, plot_sgens=False, orientation=None, load_size=1.0, gen_size=1.0, sgen_size=1.0, switch_size=2.0, switch_distance=1.0, plot_line_switches=False, plot_bus_switches=False, scale_size=True, bus_color='#1c3f52', line_color='grey', dcline_color='c', trafo_color='k', ext_grid_color='#1c3f52', switch_color='k', library='igraph', show_plot=True, ax=None, draw_by_type=True, bus_dc_size=1.0, bus_dc_color='m', line_dc_color='c', vsc_size=4.0, vsc_color='orange', highlight_buses=None, highlight_lines=None, enable_hover=True, highlight_bus_size_factor=2.0, highlight_line_width_factor=2.5, highlight_color='red', colormap_type='continuous', line_limits=(0, 25, 50, 75, 100), bus_limits=(0.9, 0.95, 1.0, 1.05, 1.1), cmap_lines=None, cmap_buses=None, plot_colorbars=True)
Plot a pandapower network as simply as possible.
If no geodata is available, artificial geodata is generated automatically. For advanced plotting options see the pandapower plotting tutorial.
Two mode buttons (“Normal” and “Colormap”) are added to the figure whenever load-flow results are available or can be computed automatically. The plot starts in Normal (flat-color) mode:
The Normal button is highlighted in magenta (= currently active).
The Colormap button is shown in dark blue (= inactive).
Clicking a button switches to that mode and updates the highlighting accordingly. Clicking the already-active button is a no-op.
In Colormap mode buses are colored by
vm_puand lines byloading_percent. Colorbars always show ticks only at the user-defined breakpoints regardless ofcolormap_type.The figure window resizes automatically:
Normal mode – compact figure; axes fill the full width.
Colormap mode – figure is widened so the network keeps the same absolute pixel size; the extra width accommodates the colorbars.
- Parameters:
net (pandapowerNet) – The pandapower network to plot.
respect_switches (bool, optional) – Respect open switches when creating artificial geodata. Ignored when
plot_line_switches=True. Default isFalse.line_width (float, optional) – Width of line segments. Default is
2.0.bus_size (float, optional) – Relative bus marker size (scaled by mean bus geodistance when
scale_size=True). Default is1.0.ext_grid_size (float, optional) – Relative external grid symbol size. Default is
1.0.trafo_size (float, optional) – Relative transformer symbol size. Default is
1.0.plot_loads (bool, optional) – Draw load symbols. Default is
False.plot_gens (bool, optional) – Draw generator symbols. Default is
False.plot_sgens (bool, optional) – Draw static generator symbols. Default is
False.orientation (float or None, optional) – Base orientation angle in radians for sgen, gen, and load symbols.
Noneuses the element-specific default. Default isNone.load_size (float, optional) – Relative load symbol size. Default is
1.0.gen_size (float, optional) – Relative gen symbol size. Default is
1.0.sgen_size (float, optional) – Relative sgen symbol size. Default is
1.0.switch_size (float, optional) – Relative switch symbol size. Default is
2.0.switch_distance (float, optional) – Relative switch distance from its bus. Default is
1.0.plot_line_switches (bool, optional) – Draw line switch symbols. Default is
False.plot_line_switches – Draw bus switch symbols. Default is
False.scale_size (bool, optional) – Scale all symbol sizes relative to the mean bus geodistance. Default is
True.bus_color (str, optional) – Flat bus marker color used in Normal mode. Default is
"#1c3f52".line_color (str, optional) – Flat line color used in Normal mode. Default is
"grey".dcline_color (str, optional) – DC line color. Default is
"c".trafo_color (str, optional) – Transformer symbol color. Default is
"k".ext_grid_color (str, optional) – External grid symbol color. Default is
"#C7105C".switch_color (str, optional) – Switch symbol color. Default is
"k".library (str, optional) – Layout library used for generic coordinate generation.
"igraph"or"networkx". Default is"igraph".show_plot (bool, optional) – Call
plt.show()at the end. Default isTrue.ax (matplotlib.axes.Axes or None, optional) – Existing axes to draw into. A new figure and axes are created when
None. Default isNone.draw_by_type (bool, optional) – Group sgen and gen symbols by element type. Default is
True.bus_dc_size (float, optional) – Relative DC bus marker size. Default is
1.0.bus_dc_color (str, optional) – DC bus marker color. Default is
"m".line_dc_color (str, optional) – DC line color. Default is
"c".vsc_size (float, optional) – Relative VSC symbol size. Default is
4.0.vsc_color (str, optional) – VSC symbol color. Default is
"orange".highlight_buses (iterable or None, optional) – Bus indices to highlight. Default is
None.highlight_lines (iterable or None, optional) – Line indices to highlight. Default is
None.enable_hover (bool, optional) – Enable interactive hover labels. Default is
True.highlight_bus_size_factor (float, optional) – Size multiplier applied to highlighted bus markers. Default is
2.0.highlight_line_width_factor (float, optional) – Line-width multiplier applied to highlighted lines. Default is
2.5.highlight_color (str, optional) – Color used for highlighted elements. Default is
"#C7105C".colormap_type (str, optional) –
"discrete"for flat color bands or"continuous"for a smooth gradient. Colorbar ticks are placed only at the breakpoints in both cases. Default is"continuous".line_limits (tuple, optional) – Breakpoints for line loading in %. Colors are auto-generated from the line palette. Entirely overridden by
cmap_lineswhen provided. Default is(0, 25, 50, 75, 100).bus_limits (tuple, optional) – Breakpoints for bus voltage in p.u.. Colors are auto-generated from the bus palette. Entirely overridden by
cmap_buseswhen provided. Default is(0.9, 0.95, 1.0, 1.05, 1.1).cmap_lines (list or None, optional) – Full custom colormap definition for lines; overrides
line_limits. Discrete:[((min, max), color), ...]Continuous:[(value, color), ...]Default isNone.cmap_buses (list or None, optional) – Full custom colormap definition for buses; overrides
bus_limits. Same format ascmap_lines. Default isNone.plot_colorbars (bool, optional) – Show colorbars in the Colormap view. Default is
True.plot_bus_switches (bool)
- Returns:
The axes object containing the network plot.
- Return type:
matplotlib.axes.Axes
When drawing Static Generators by type the used Patches are:
A helper function for angle calculation is provided. It will use all elements in a network to calculate angles for each patch based on the amount of elements at each bus.
- pandapower.plotting.calculate_unique_angles(net)
Calculate patch placement angles for sgen, gen, and load symbols at each bus.
Only a single patch for all loads at a given bus is currently supported.
- Parameters:
net (pandapowerNet) – The pandapower network to calculate patch angles for.
- Returns:
- Nested mapping of the form
{bus_index: {element_type: {sub_type: angle_rad}}}. Angular offsets are in radians. For loads the inner value is a plainfloatinstead of a nested dict, because loads are not grouped by sub-type.
- Return type:
dict
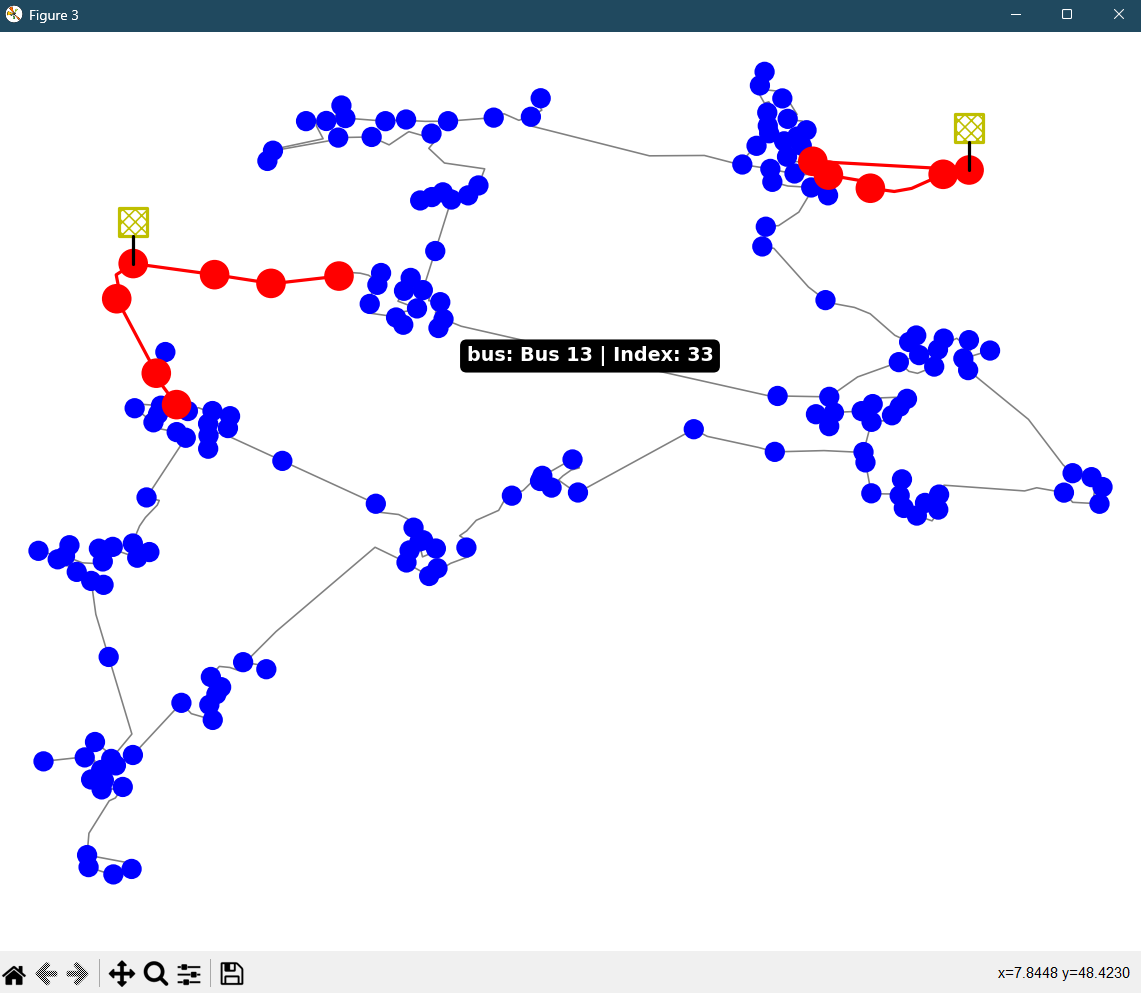
Simple Highlighting Plot
The function simple_plot() can also highlight lines or buses in a simple network plot. The highlighted
elements are displayed in red and enlarged. Additionally, buses and lines can be located directly
in the plot by hovering the mouse over a specific line or bus. The name and index will be shown in
a small box:
net = mv_oberrhein()
ol_lines = net.line.loc[net.line.type=="ol"].index
ol_buses = net.bus.index[net.bus.index.isin(net.line.from_bus.loc[ol_lines]) |
                         net.bus.index.isin(net.line.to_bus.loc[ol_lines])]

simple_plot(net, hl_lines=ol_lines, hl_buses=ol_buses, enable_hovering=True)