Draw Collections
- pandapower.plotting.draw_collections(collections, figsize=(10, 8), ax=None, plot_colorbars=True, set_aspect=True, axes_visible=(False, False), copy_collections=True, draw=True, aspect=('equal', 'datalim'), autoscale=(True, True, True))
Draws matplotlib collections which can be created with the create collection functions.
- Parameters:
**collections** (list)
**figsize** (tuple, (10,8))
**ax** (axis, None)
**plot_colorbars** (bool, True)
**set_aspect** (bool, True)
set. (should be)
**axes_visible** (tuple, (False, False)) - defines visibility of (xaxis, yaxis)
- Returns:
ax - matplotlib axes
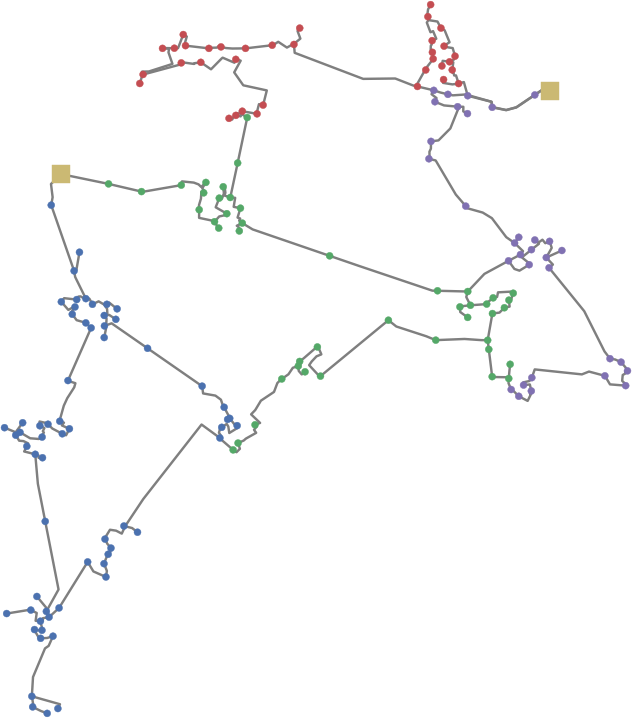
Example plot with mv_oberrhein network from the pandapower.networks package: