Draw Collections
-
pandapower.plotting.draw_collections(collections, figsize=(10, 8), ax=None, plot_colorbars=True, set_aspect=True, axes_visible=(False, False), copy_collections=True, draw=True)¶ Draws matplotlib collections which can be created with the create collection functions.
- Input:
- collections (list) - iterable of collection objects, may include tuples of collections
- OPTIONAL:
figsize (tuple, (10,8)) - figsize of the matplotlib figure
ax (axis, None) - matplotlib axis object to plot into, new axis is created if None
plot_colorbars (bool, True) - defines whether colorbars should be plotted
- set_aspect (bool, True) - defines whether ‘equal’ and ‘datalim’ aspects of axis scaling
- should be set.
axes_visible (tuple, (False, False)) - defines visibility of (xaxis, yaxis)
- OUTPUT:
- ax - matplotlib axes
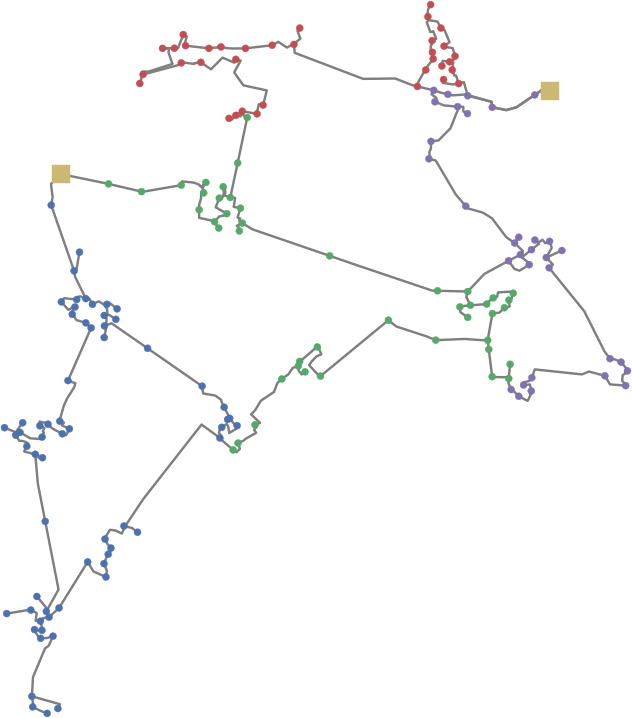
Example plot with mv_oberrhein network from the pandapower.networks package: