Built-in plot functions
In order to get idea about interactive plot features and possibilities see the tutorial.
Simple Plotting
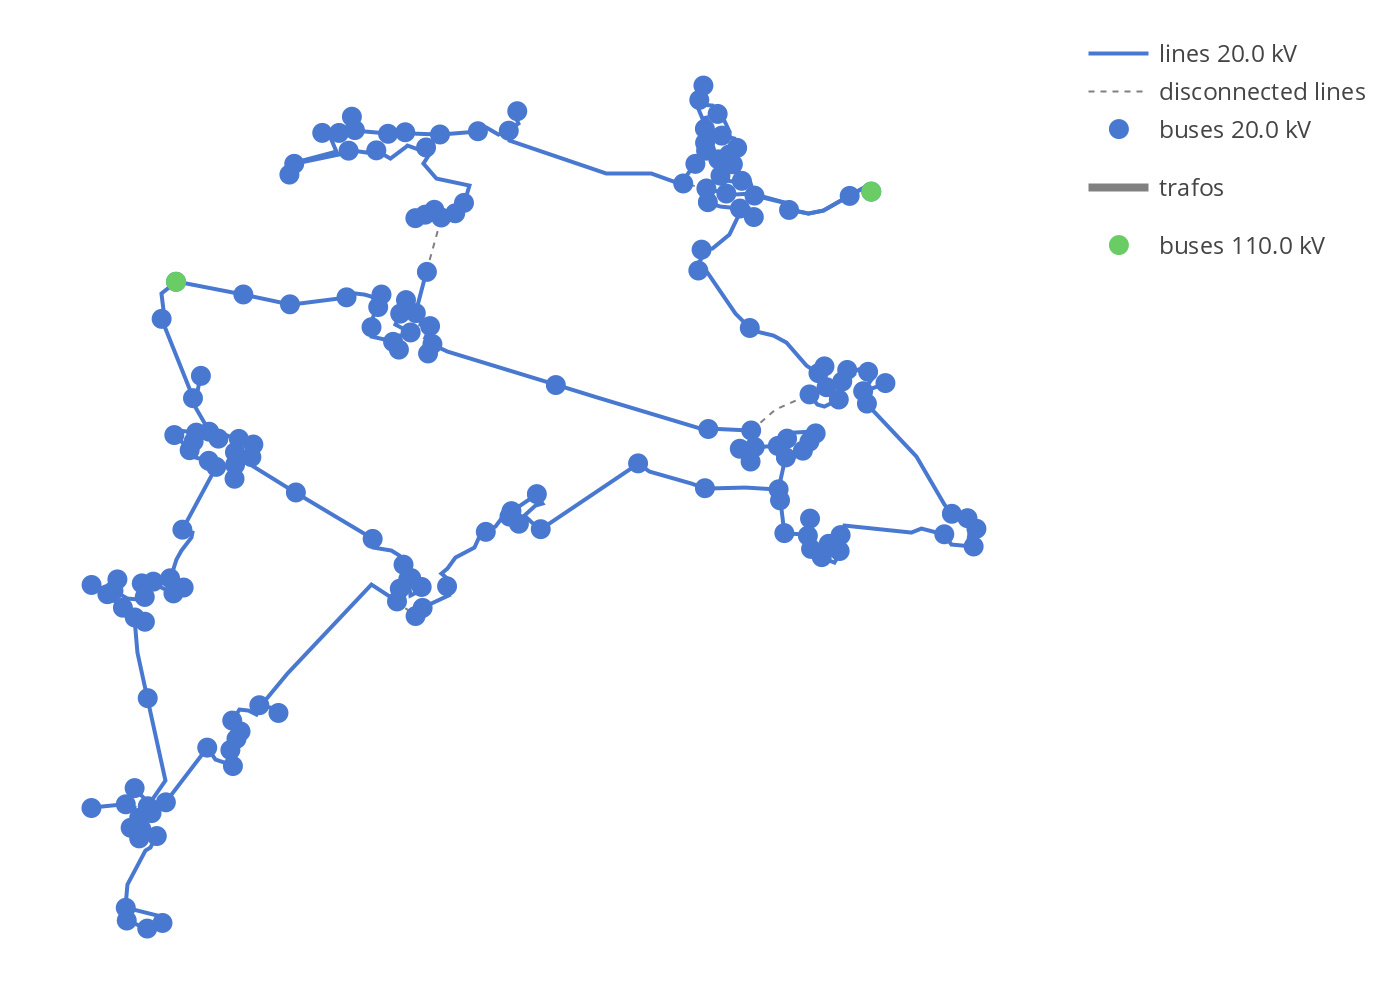
The function simple_plotly() can be used for a simple interactive plotting.
Example plot with mv_oberrhein network from the pandapower.networks package:
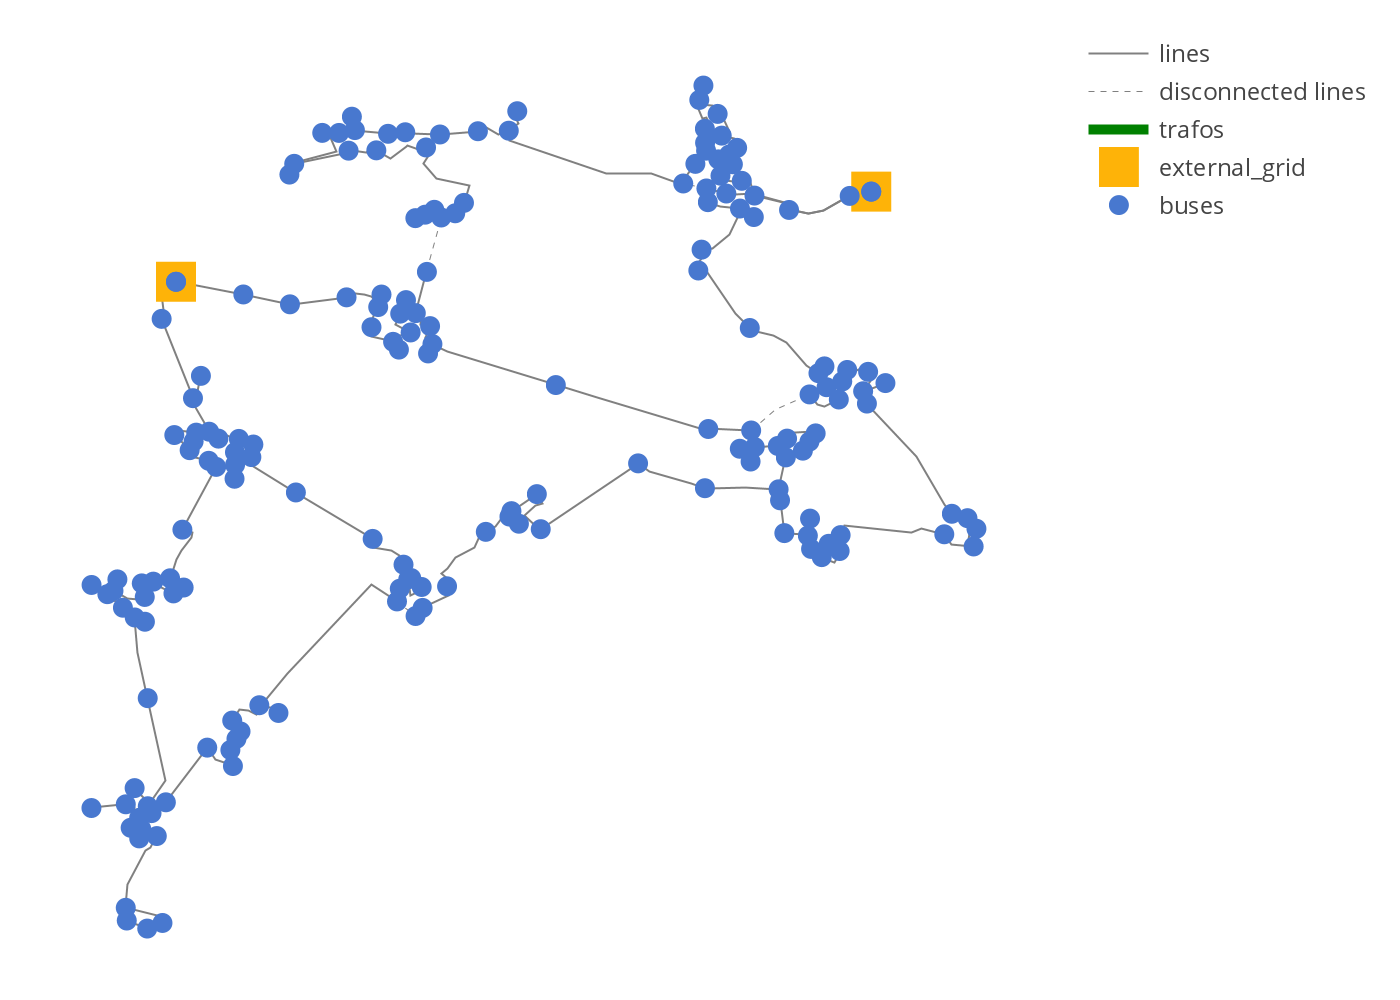
Example simple plot
from pandapower.plotting.plotly import simple_plotly
from pandapower.networks import mv_oberrhein
net = mv_oberrhein()
simple_plotly(net)
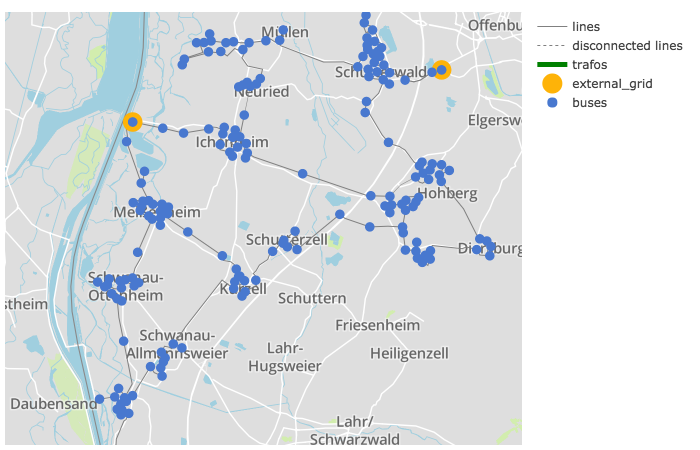
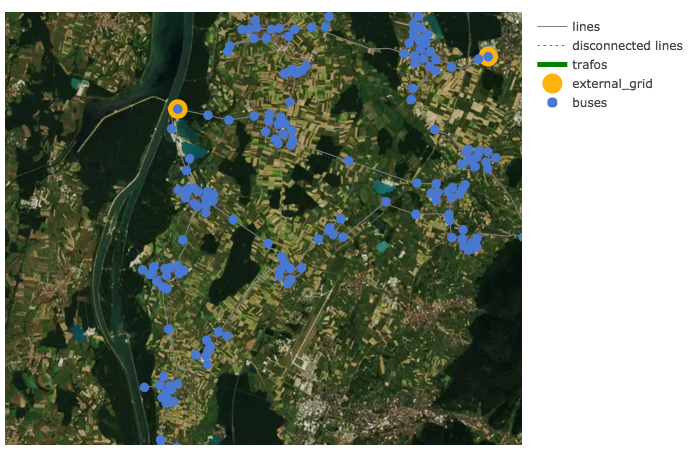
Example simple plot on a map:
net = mv_oberrhein()
simple_plotly(net, on_map=True, projection='epsg:31467')
Network coloring according to voltage levels
The function vlevel_plotly() is used to plot a network colored and labeled according to voltage levels.
Example plot with mv_oberrhein network from the pandapower.networks package:
from pandapower.plotting.plotly import vlevel_plotly
from pandapower.networks import mv_oberrhein
net = mv_oberrhein()
vlevel_plotly(net)
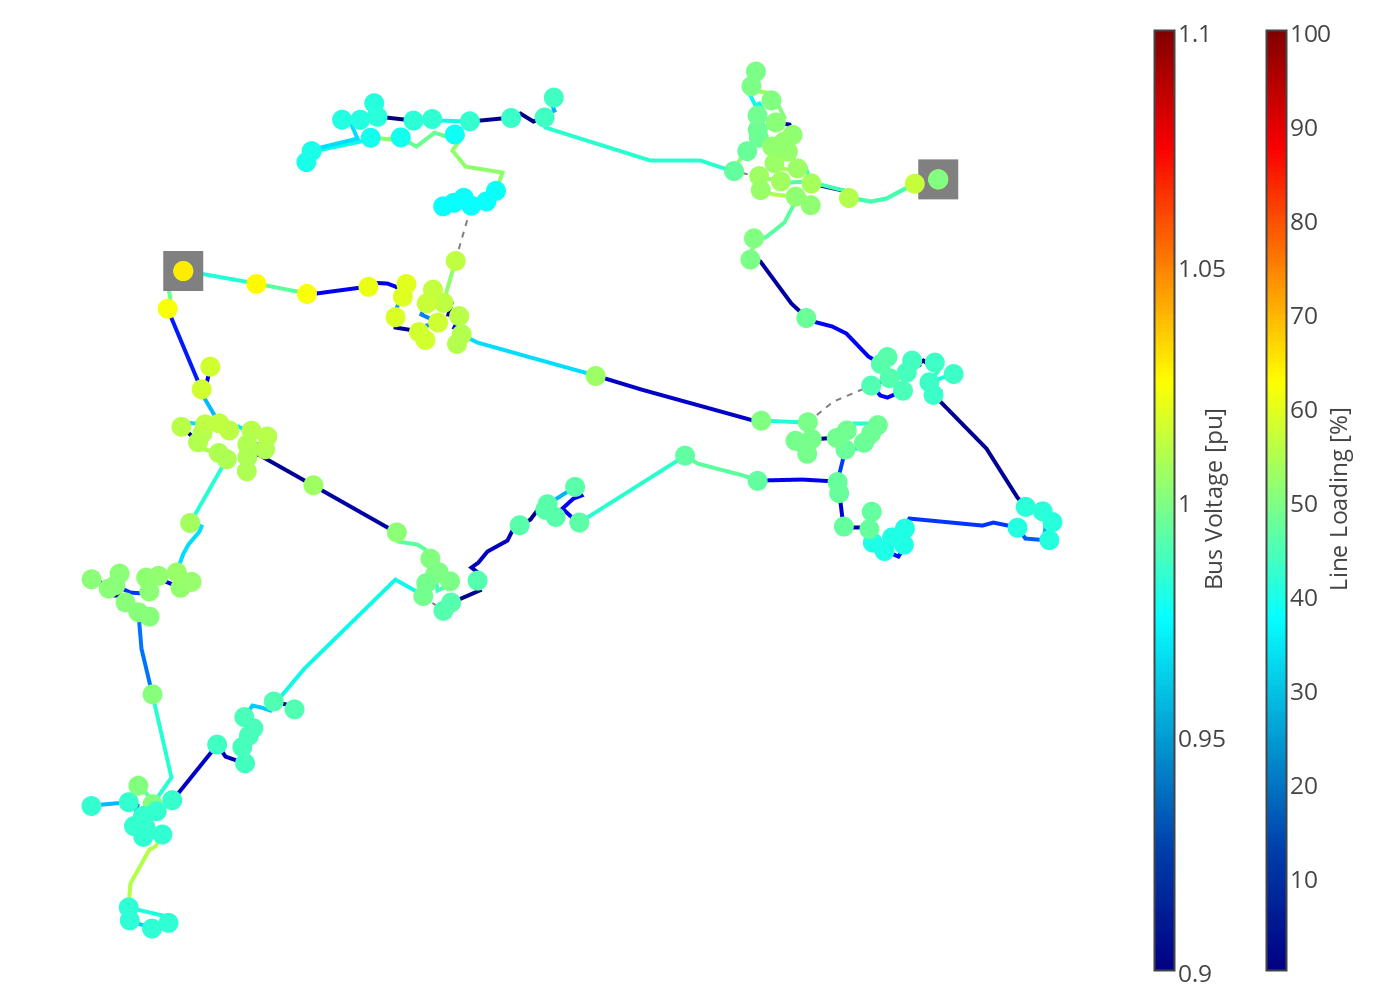
Power Flow results
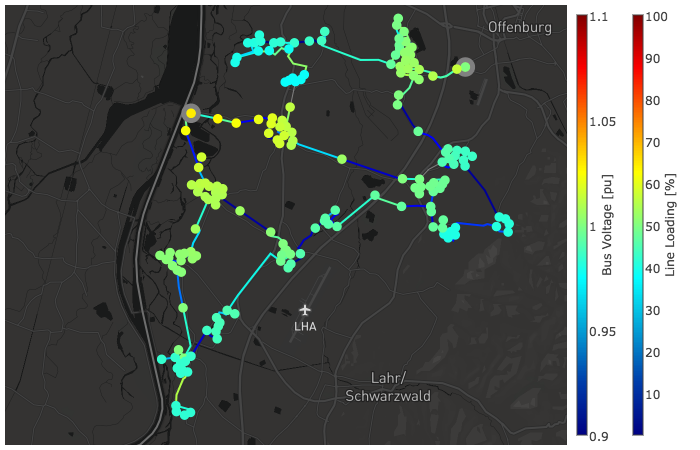
The function pf_res_plotly() is used to plot a network according to power flow results where a colormap is used to represent line loading and voltage magnitudes. For advanced possibilities see the tutorials.
Example power flow results plot:
from pandapower.plotting.plotly import pf_res_plotly
from pandapower.networks import mv_oberrhein
net = mv_oberrhein()
pf_res_plotly(net)
Power flow results on a map:
net = mv_oberrhein()
pf_res_plotly(net, on_map=True, projection='epsg:31467', map_style='dark')